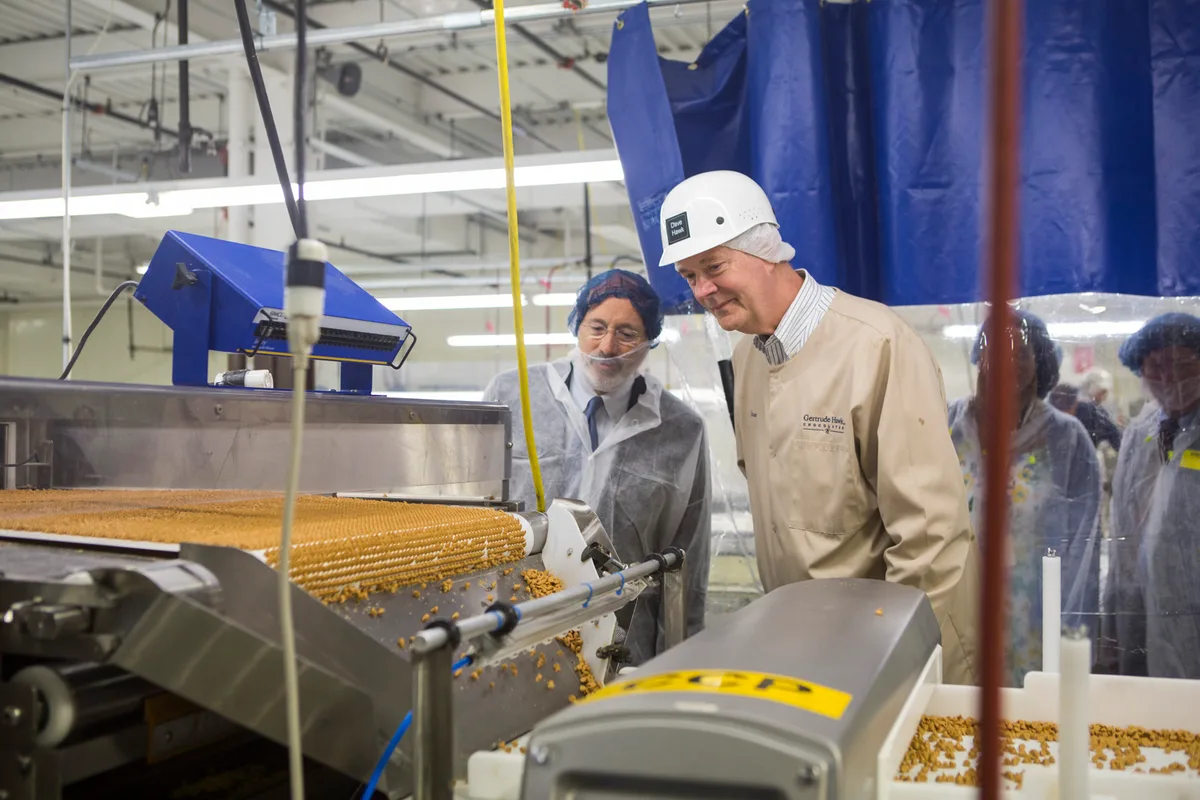
Manufacturing employment is the most over-read number in the jobs report. The Bureau of Labor Statistics releases it at 8:30 a.m. on the first Friday of most months, alongside headline payroll growth, and commentators treat the factory line as a verdict on tariffs, automation, and the industrial base all at once. It is a survey estimate of 12.8 million-ish workers, subject to sampling error, annual benchmarking, and definitional edges that blur what counts as a manufacturing job in the first place.
Where does the number come from?
The employment situation report blends two surveys. The payroll count — the source of the manufacturing employment figure — comes from a survey of establishments: employers report headcount, hours, and pay. The unemployment rate comes from a survey of households, which is why the two can disagree in the same month. Manufacturing is one of the industries the payroll survey reports directly, broken into durable goods, like machinery and vehicles, and nondurable goods, like food and chemicals. The first print for any month is preliminary; it is revised twice in the following two months and re-benchmarked annually against unemployment insurance tax records, which are near-census quality and can move the level by a hundred thousand or more across the economy.
What does 'manufacturing employment' actually measure?
It measures jobs located at establishments classified as manufacturing — not jobs in manufacturing supply chains. A design engineer at a contract manufacturer counts; the same engineer at a brand that outsources production does not. Contract manufacturers' growth inflates the factory count while total system employment may be flat, because work moved from one firm's payroll to another's. The reverse happens with outsourcing. This classification churn is invisible in the monthly print but large over years, which is why economists read the factory number alongside the manufacturing workweek and overtime from the same report.
Which companion numbers carry signal?
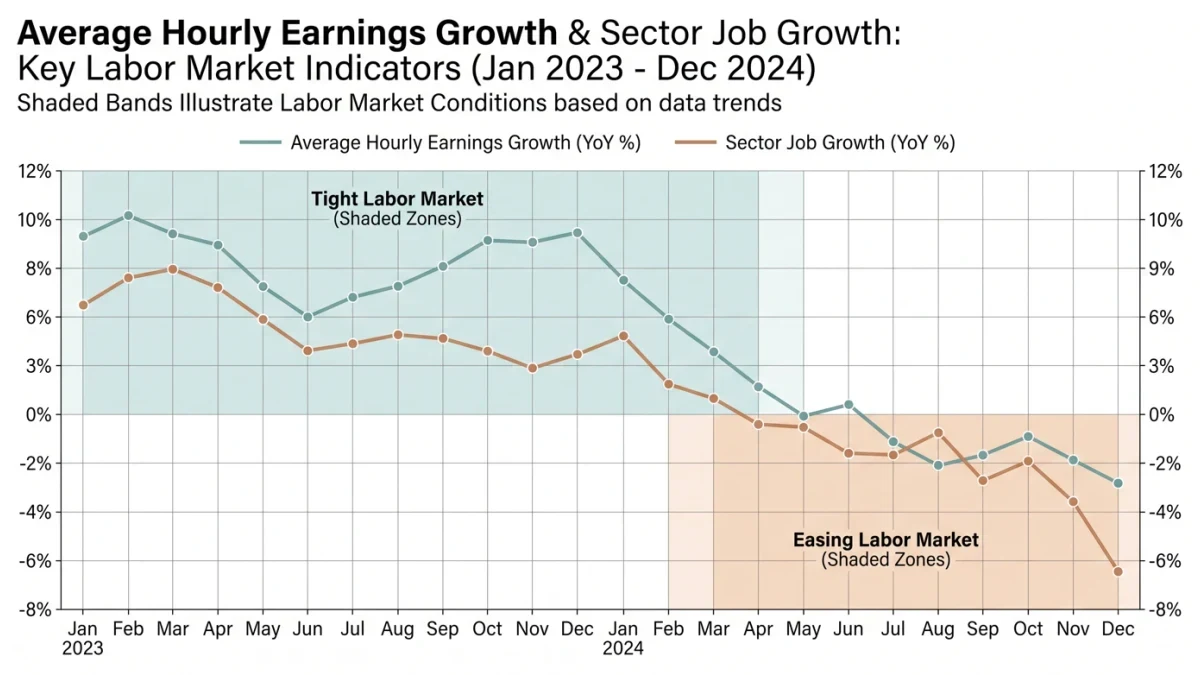
The workweek and overtime hours are leading. Factories adjust hours before headcount: overtime rising for two or three months typically precedes hiring, and a shrinking workweek precedes layoffs. Average hourly earnings for production workers show wage pressure in the sector. On the demand side, the Institute for Supply Management's surveys and the Census Bureau's durable-goods orders — especially core capital-goods orders, which strip out aircraft and defense — track what factories will be busy with in coming months. Job openings and layoffs data from the same BLS suite show whether employment is falling because of layoffs or because retirements outpace hiring; those are different economies.
What are the classic misreadings?
First, month-to-month noise: the payroll survey's confidence interval around a monthly change is wide enough that a 10,000-job move is statistically indistinguishable from zero. Second, the payroll adjustment for new-business formation, which can swing manufacturing's early prints when business births and deaths shift. Third, strike effects: a major work stoppage can knock tens of thousands off the factory count and add them back the next month, mechanically, without any real change. Fourth, treating the level as a policy scorecard: US manufacturing employment has hovered in the twelve-to-thirteen million range for years while output per worker climbed — employment measures jobs, not health.
How do tariffs show up in this data?
Slowly and on both sides. Tariff-protected industries can add shifts while tariff-exposed downstream industries cut them, leaving the net near zero even as the composition churns. Since the metals tariffs of 2018 and the broader actions of 2025-2026, analysts have tracked primary-metals employment against fabricated-metals and machinery employment for exactly this reason — the sign of the net says little about who won. The durable-goods split is the quickest check: vehicle, machinery, and aircraft moves dominate the category and deserve separate reads before crediting or blaming trade policy.
A five-minute reading routine
Start with the level and twelve-month change for context. Check the workweek and overtime for direction. Split durable from nondurable. Note any strike or weather footnote. Wait for the second revision before writing a trend line. The reward is being right a quarter later, when the headlines written from the first print have been quietly corrected.