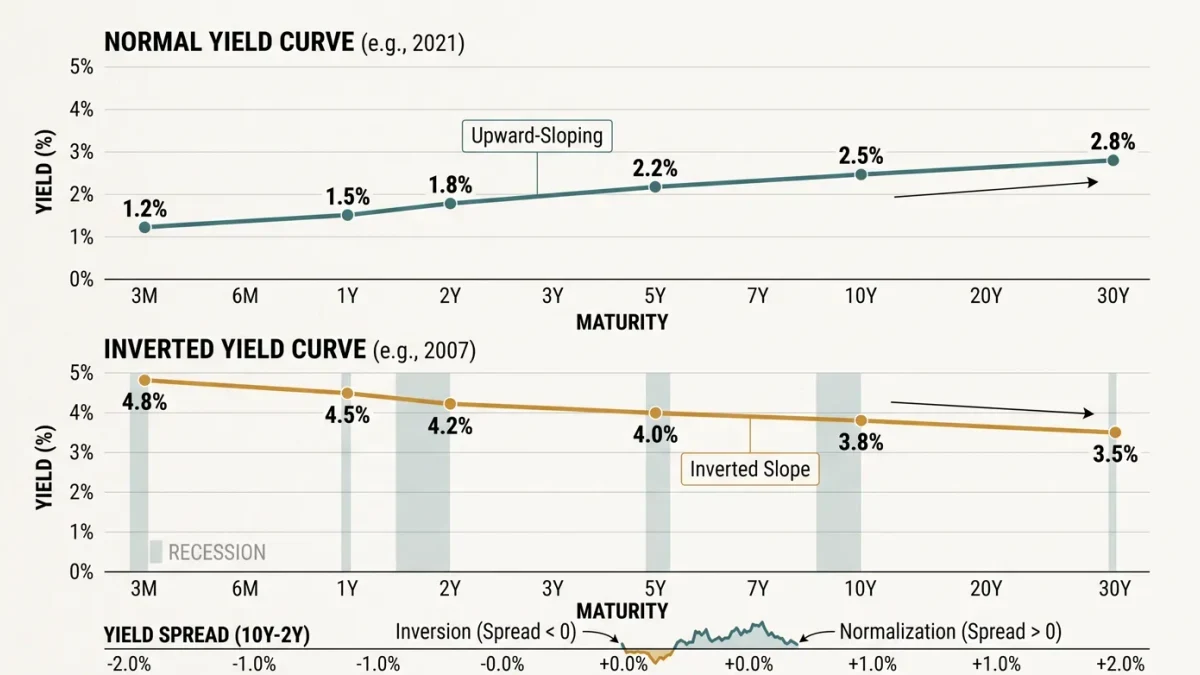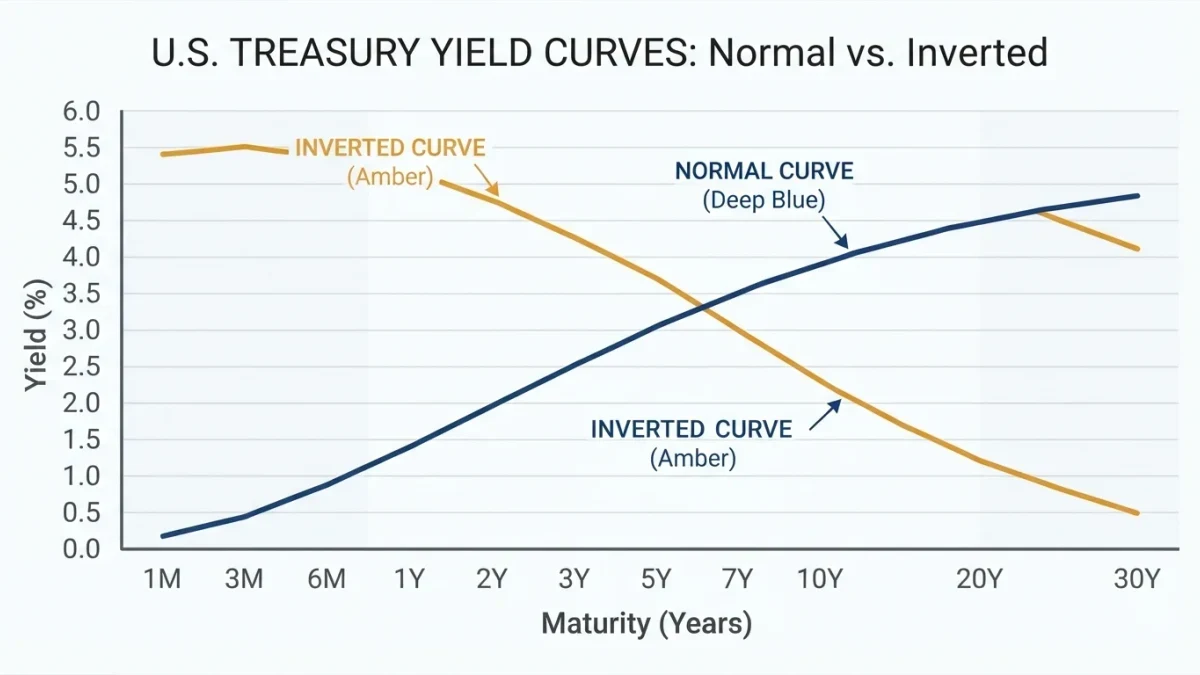
The yield curve is the bond market's longest-running forecast, and its track record earns both the respect and the skepticism it receives. An inversion — short-term Treasury yields rising above long-term ones — preceded most American recessions since the 1950s, with no false positives in the modern era until the 2022-2024 episode muddied the record. The catch is timing: the lag between inversion and recession has run from six months to two years, and the curve can normalize before anything happens. As a signal it is real; as a calendar it is useless.
What is the curve and why does it invert?
Yields across maturities form the curve: three months out to thirty years. Normally it slopes upward — longer loans pay more — because lenders demand compensation for time and inflation risk. Inversion means the market expects policy rates to fall, which usually means the market expects the economy to weaken badly enough that the central bank will cut. The most watched measures compare the 10-year yield to the 3-month or 2-year; the 3-month version is the one with the cleaner recession record, per Federal Reserve research.
What does an inversion actually tell you?
That expected average policy rates over the next decade sit below current short rates. Read that again: it is a statement about expectations, not a mechanism that causes recession. The causal channels exist — banks borrow short and lend long, so inverted curves compress net interest margins and tighten credit supply — but the transmission is imperfect, which is why this cycle's deeply inverted curve coexisted with resilient lending for longer than the textbook predicted. The curve is a thermometer; sometimes the fever is elsewhere.
What happened in the 2022-2026 cycle?
An unusually long, deep inversion — driven by rapid rate increases against stubborn inflation — persisted for a historically extended stretch without the recession the pattern implied, as growth held up while the curve normalized. The honest reading is unsettled. One camp argues the signal failed because bond yields now embed term-premium distortions from quantitative easing and Treasury issuance — the supply of long bonds can flatten or steepen the curve for reasons unrelated to growth expectations. Another camp notes the pandemic-era economy broke most cycle rules at once and the recession may simply have been late. Both can be true; neither is falsified yet.
How should a reader use it now?
As one instrument on a dashboard, alongside credit spreads, the leading indicators index, claims for unemployment insurance, and the Sahm rule — which triggers on the unemployment rate's three-month average rising half a point off its low and has a tighter historical clock. Watch the curve's shape for more than its level: a bull steepening after inversion — short rates falling faster than long — is the classic recession-approaching configuration. And watch the front end for what the Fed is priced to do: after the December 2025 cut to 3.50%-3.75% passed 9-3, the curve's front-end pricing became a live map of the committee's internal argument.
What is the reliable summary?
Ignore the curve and you ignore a signal with the best unbroken record in macroeconomics. Obey it blindly and you will exit every asset years early, twice. Use it the way a sailor uses a barometer: a falling reading means weather is more likely, not that it is raining, and the instrument tells you nothing about when or how hard. The curve earns a place on the dashboard — at the edge, with its history written next to it in pencil.