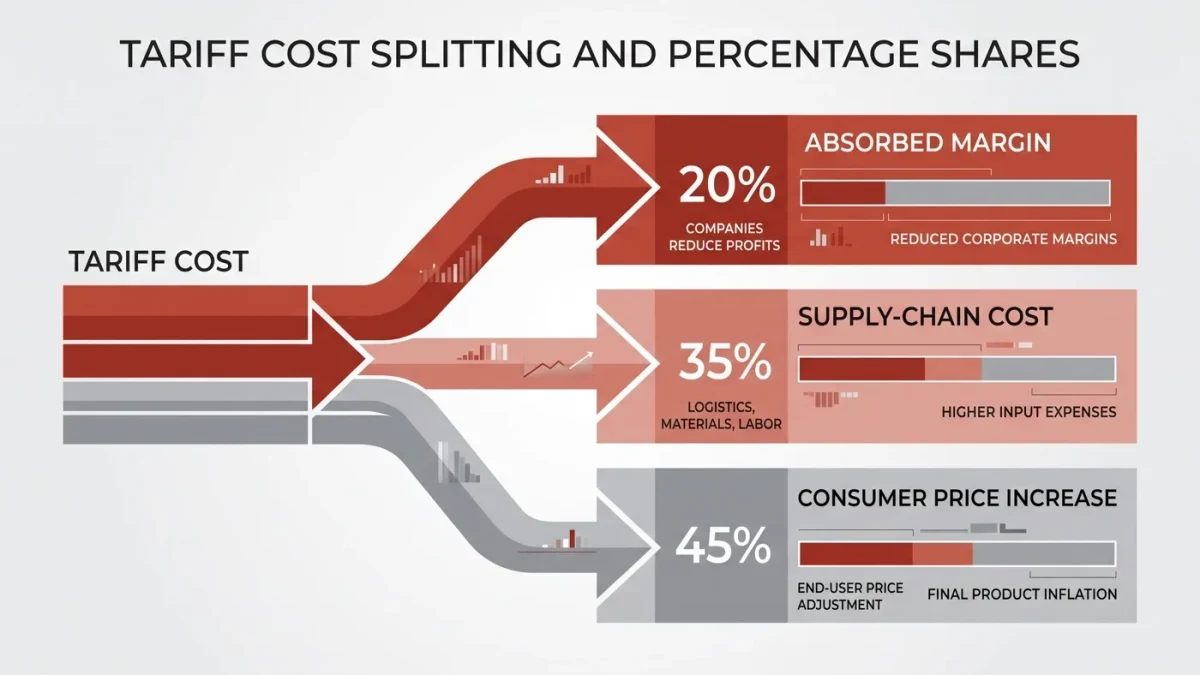
Tariffs raise some prices once, and the 12-month inflation rate reports that event for exactly twelve months — the arithmetic is that clean and that misunderstood. What consumers experienced through 2025 and into 2026 follows the pattern the 2018-2019 episodes established: cost increases concentrated in tariff-exposed goods, arriving over months as inventories and contracts turn, partially offset by substitution and margin absorption, and then dropping out of the year-over-year calculation as the comparison base catches up. Understanding the mechanics turns a confusing inflation narrative into a predictable one.
Why the arrival is gradual
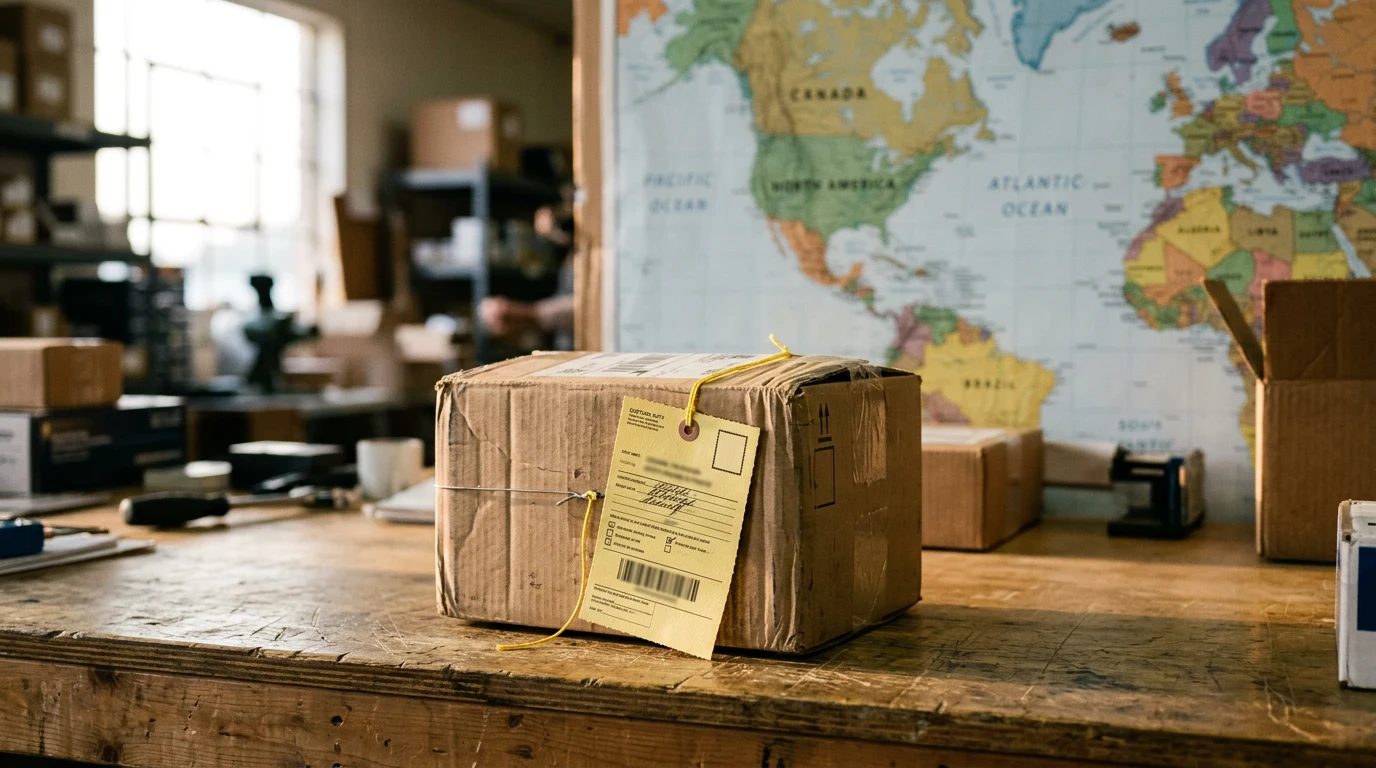
Three buffers sit between a proclamation and a shelf price. Inventory: goods already imported at the old rate sell at the old cost until the stock turns — months for container-loads of merchandise. Contracts: retailer-supplier agreements reset on annual cycles, so pass-through waits for renegotiation. Margin: importers and retailers absorb part of the hit first, restoring it gradually through the following quarters — visible in earnings commentary as tariff-cost headwinds. The empirical record from both recent cycles shows the pass-through peaking several quarters after the tariff's effective date, not in the first prints.
Level shift versus inflation rate
The distinction that matters. A tariff raises the price level of affected goods — a one-time step. The inflation rate — the change in prices over twelve months — rises while the step feeds through and falls mechanically when the step exits the comparison window. An economy can therefore have tariff-driven 12-month inflation of noticeable size with no ongoing inflation process at all, which is precisely the pattern core-goods and tariff-exposed category data showed through 2026. The converse error also recurs: treating the mechanical fade as evidence that tariffs did nothing. The price level stayed up; only the rate of change normalized.
Where the price pressure showed up
Concentrated, not broad. Categories with direct tariff exposure — appliances, electronics, tools, furniture, apparel inputs — carried the visible increases, per BLS category data as analyzed in economic commentary. Services — the majority of the index — barely moved for tariff reasons. Substitution reshaped the pattern: buyers traded down, switched brands, or bought unraised alternatives, which dampens measured inflation while shifting the cost onto quality and variety — a real welfare cost the price index understates by design.
What reversals do
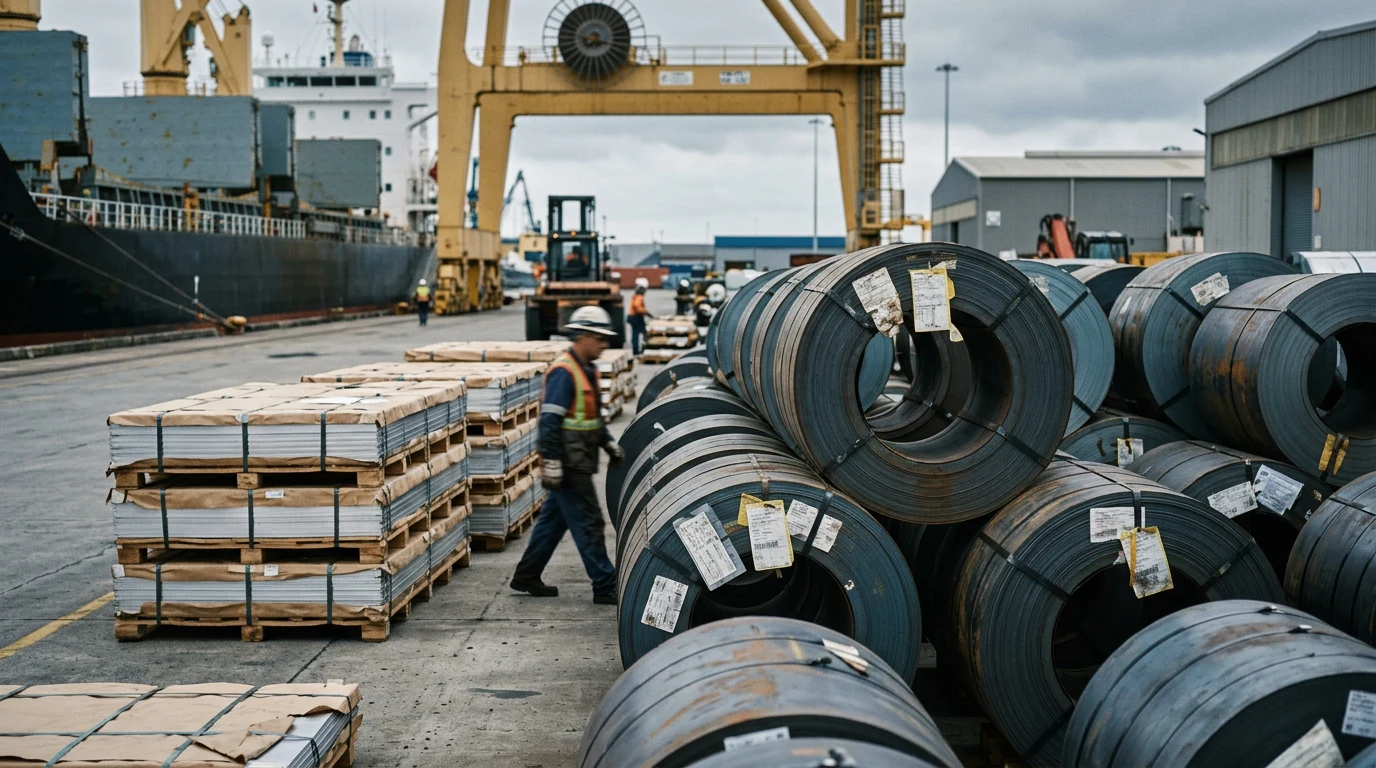
2026 provided the natural experiment. When the IEEPA tariffs were rescinded in February 2026 after the Supreme Court ruling, the entry mechanism ran in reverse at the same speed: prices adjusted at contract reset, not instantly; margins that had absorbed costs unwound gradually; and categories where substitution had already occurred did not fully retrace. The metals-rate reductions of mid-2026 — certain steel, aluminum, and copper rates cut from 25% to 15% in July — will follow the same lagged path into durable-goods and construction-input prices. Pass-through economics is symmetric but sticky: down is slower than up, because list prices that rose keep anchor while competitors quietly discount.
How to read the next round
Match the tariff's product annex to CPI categories and watch those categories' year-over-year prints against the effective-date-plus-three-quarters timeline. Track the PPI for imported goods as the upstream signal, retailer earnings commentary as the margin channel, and the BLS's own category detail rather than the headline. And hold the two truths simultaneously: tariffs did raise the price level of the affected goods, and the inflation rate's tariff component is temporary arithmetic. Both facts survived every cycle since 2018; only the commentary forgot them each time.