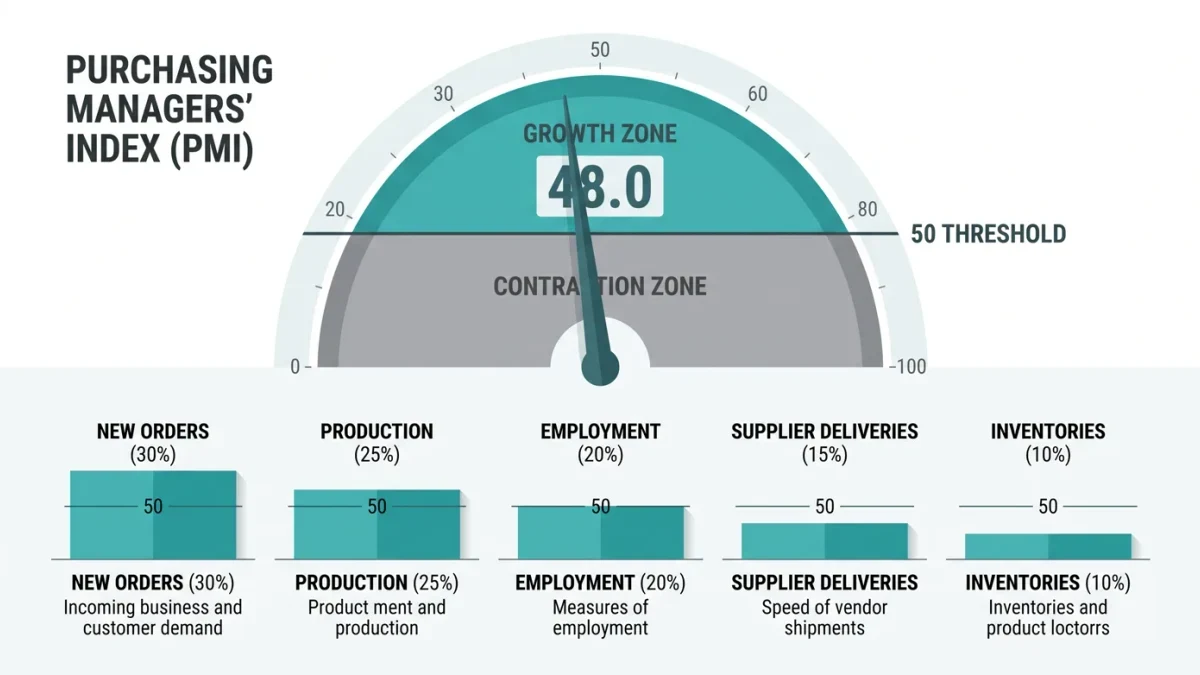
The fastest read on manufacturing is a survey of the people who do the buying. Purchasing managers' indexes — most prominently the Institute for Supply Management's manufacturing PMI in the United States — land on the first business day of each month, weeks before the hard data on production, employment, and trade arrive. They are opinion measures that behave like data, which is their strength and their trap.
How is a PMI built?
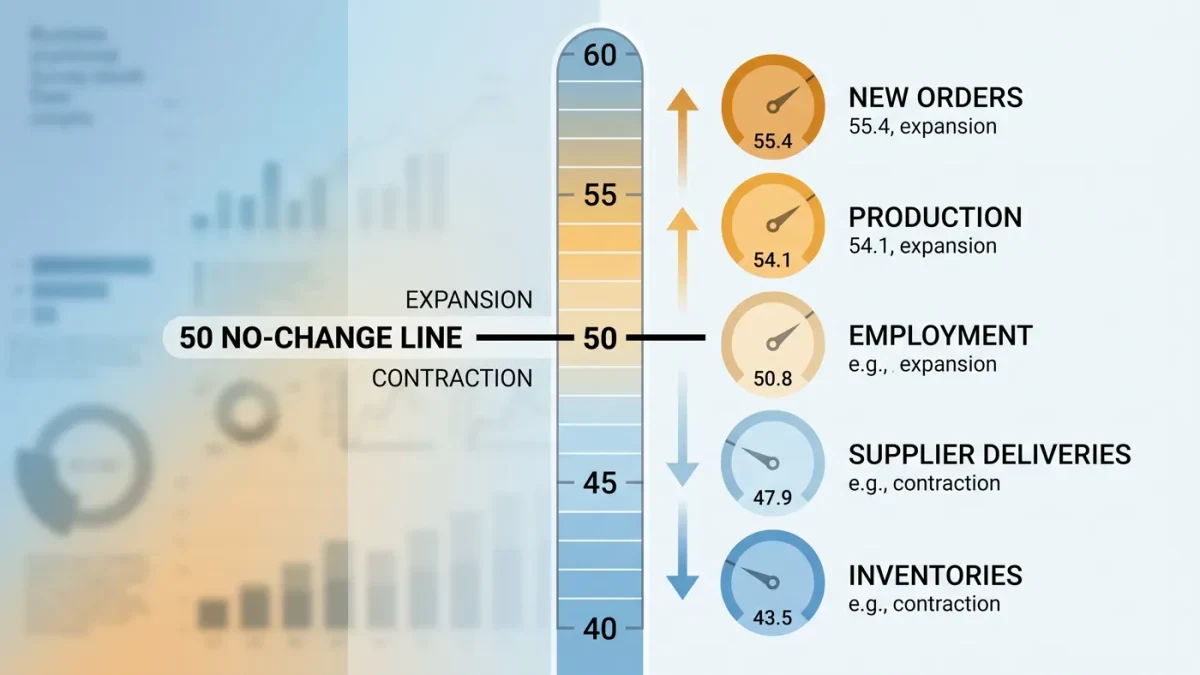
Survey respondents — supply executives at manufacturers — answer whether conditions in new orders, production, employment, supplier deliveries, and inventories are better, the same, or worse than last month. Each component becomes a diffusion index: 50 means no change, readings above mean growth, below mean contraction. The headline PMI blends the components with fixed weights. The mathematics amplify turns — a modest shift in the balance of responses moves the index by points — and the supplier-deliveries component has a famous quirk: slower deliveries raise the index, because in normal times slow deliveries mean busy factories. In disruption times, slow deliveries mean broken supply chains. The index cannot tell the difference, so strong demand readings sometimes describe ports, not prosperity.
Why does the 50 line matter so much?
Because of its empirical association with the broader economy: ISM's own historical analysis ties PMI levels above roughly 42-43, sustained, with overall economic growth, with 50 marking the manufacturing sector's own expansion line. Manufacturing is cyclical and leads the wider economy, so the PMI crosses 50 before GDP turns — and before the employment data confirm. The signal is real; the noise is too. One month's move is weather, strike, or survey sampling. The conventions that work: look at three-month averages, the new-orders component — the most forward-looking of the five — and the breadth across industries in the survey's supplementary tables.
What do PMIs contribute in a tariff era?
Speed and mood. Tariff changes show up in PMIs before anywhere else: the respondents' comments — published verbatim with the release — name duty costs, front-running purchases, and supplier re-sourcing decisions in the month they happen, while the trade and price statistics catch up a quarter later. The prices-paid component, which tracks input inflation, registered the 2025-2026 tariff pass-through in real time. And the surveys capture decision-relevant uncertainty — the gap between managers reporting worse conditions and those reporting stockpiling ahead of deadlines is the difference between a slowdown and a distortion, and only the comment text distinguishes them.
What are the limits?
Sample size and composition: the panel is a few hundred respondents weighted toward large firms, so small-shop conditions arrive late and softened. Softness by construction: it is stated intention and perception, not output — respondents can be wrong collectively, and were at moments in the pandemic recovery. Revision absence: PMIs are not revised, which means the hard data can tell a different story later without the survey ever acknowledging it. And sector rotation: an index dominated by a few large industries can print a national mood that describes two industries' quarters.
How to use them properly
Pair each PMI with its hard-data counterpart: the ISM new-orders index with Census core capital-goods orders; the production component with the Federal Reserve's industrial production release; prices-paid with the PPI. Treat the comment text as the primary source and the number as the summary. Read manufacturing and services PMIs together — the divergence between a contracting factory sector and an expanding services sector was the defining pattern of several recent years, and each alone misleads. The surveys are the economy telling you how it feels; the statistics agencies tell you how it is. The order of arrival is why you read the feelings first.