The monthly trade deficit is the most misquoted number in economic reporting. It falls and headlines call it improvement; it rises and headlines call it deterioration — when month to month it is mostly container scheduling, oil prices, and aircraft. The Bureau of Economic Analysis and Census Bureau release goods and services trade data monthly, and the serious signals sit in the quarterly detail, the price-versus-volume split, and the revisions that follow. Readers who learn the structure stop being surprised by the number.
What the deficit measures — and does not
The trade balance is exports minus imports of goods and services. It is an accounting identity, not a scorecard: a deficit means the country bought more from abroad than it sold, matched by a capital-account surplus — foreign claims on US assets — by construction. It does not measure competitiveness, fairness, or manufacturing health directly; it moves with the dollar, growth differentials, oil prices, and corporate pricing. A strong economy with confident consumers imports more; a recession shrinks the deficit. That inverse relationship is why the deficit often improves precisely when things are bad.
What makes the monthly number so noisy
Lumpy categories. Commercial aircraft, pharmaceuticals, and semiconductor equipment ship in handfuls of very large transactions, so a single delivery swings the goods balance by billions. Oil prices move the petroleum line without any volume change. Port timing and Chinese New Year distort first-quarter prints predictably. And the release is revised: the monthly figures are estimates built partly on unit-value price proxies, later corrected when actual transaction data from customs and the Treasury arrive. The advance number is a sketch; the annual revision is the photograph.
What did tariffs do to the deficit?
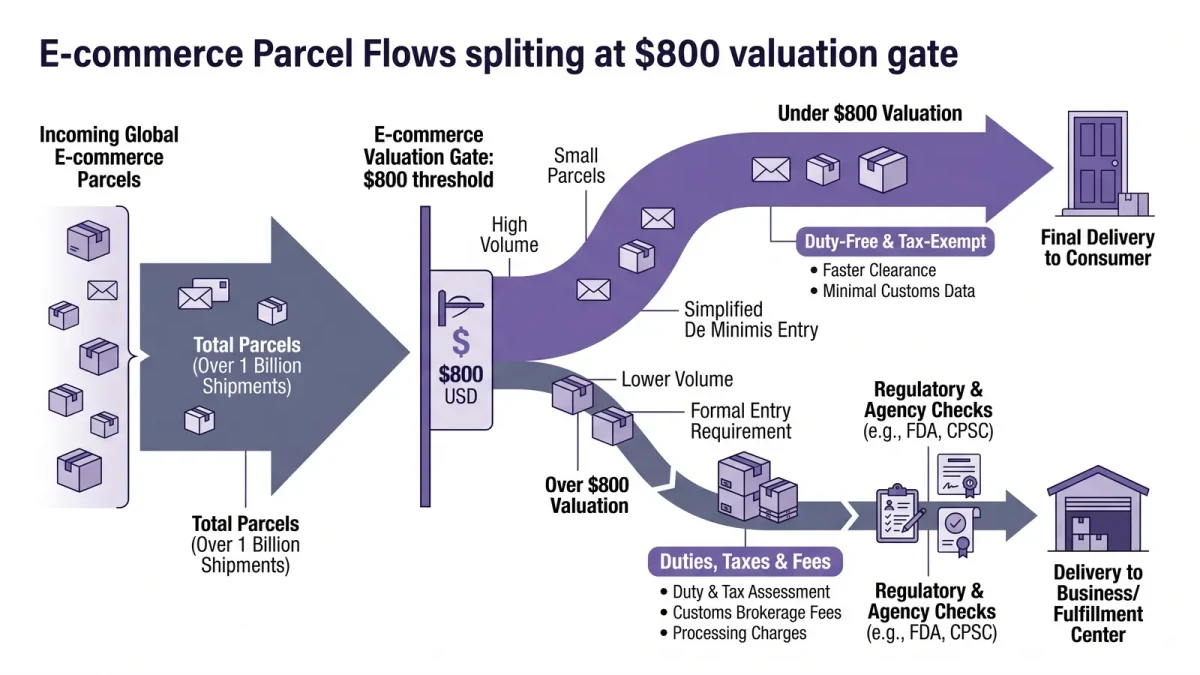
Distorted its monthly path without moving the macro identity. Three mechanisms. Front-running: importers accelerated purchases ahead of tariff effective dates, swelling the deficit before the deadline and shrinking it after — the pattern of 2025's monthly prints, per Census data. Price effects: tariffs raise import values at the border for the same physical volume, mechanically widening the measured deficit while it lasts. Re-routing: goods moving through connector countries change the bilateral deficits — the China deficit narrowed while the Mexico and Vietnam deficits widened, with Chinese inputs flowing through both, per trade analyses. The overall balance, anchored to capital flows and the dollar, proved far harder to move — the persistent lesson of every tariff era since the 1970s.
How to read the release properly
Three-month averages, not month-over-month. The price-versus-volume split — the real oil line tells you whether petroleum widened the deficit by barrels or by price. The capital-goods categories, which carry the aircraft noise. Bilateral data read with re-routing in mind: a narrowing China deficit alongside widening connector deficits is relocation, not decoupling. And the quarterly services surplus — the United States runs a large services surplus that the goods-centric headline commentary routinely forgets. For policy judgment, the stablest measure is the trade balance as a share of GDP, quarterly, which is the version economists actually use.
The honest summary
The deficit tells you how much the country invests relative to what it saves, mediated by the dollar's role in the world. Tariffs change the composition of trade — who ships what, through which port, at which price — and the evidence of every recent cycle says they change the total far less than the speeches promise. Watch the detail for the restructuring; distrust the monthly headline for anything. The number is a sketch that becomes a photograph annually, and the readers who wait see the picture.