The Consumer Price Index is the most consequential statistic the government publishes monthly, and the least understood number inside it is usually the one doing the work. Headline CPI gets the headline; core CPI gets the Fed's attention; and the components — shelter, used cars, airfares, and the tariff-sensitive goods categories — tell you whether a print is news or noise. A working method takes ten minutes and changes how you read every inflation report from now on.
What is CPI and what does it measure?
The Bureau of Labor Statistics prices a fixed basket of consumer goods and services monthly, collecting quotes from stores, websites, and housing surveys. The 12-month change in the index is the inflation rate everyone quotes; the monthly change is what traders trade, expressed seasonally adjusted. Core CPI strips food and energy — not because they do not matter, but because they are volatile in ways that say little about the trend, and the Fed watches core as the signal inside the noise. There is also a lag: the January report describes December's prices, published mid-February.
Why shelter dominates everything
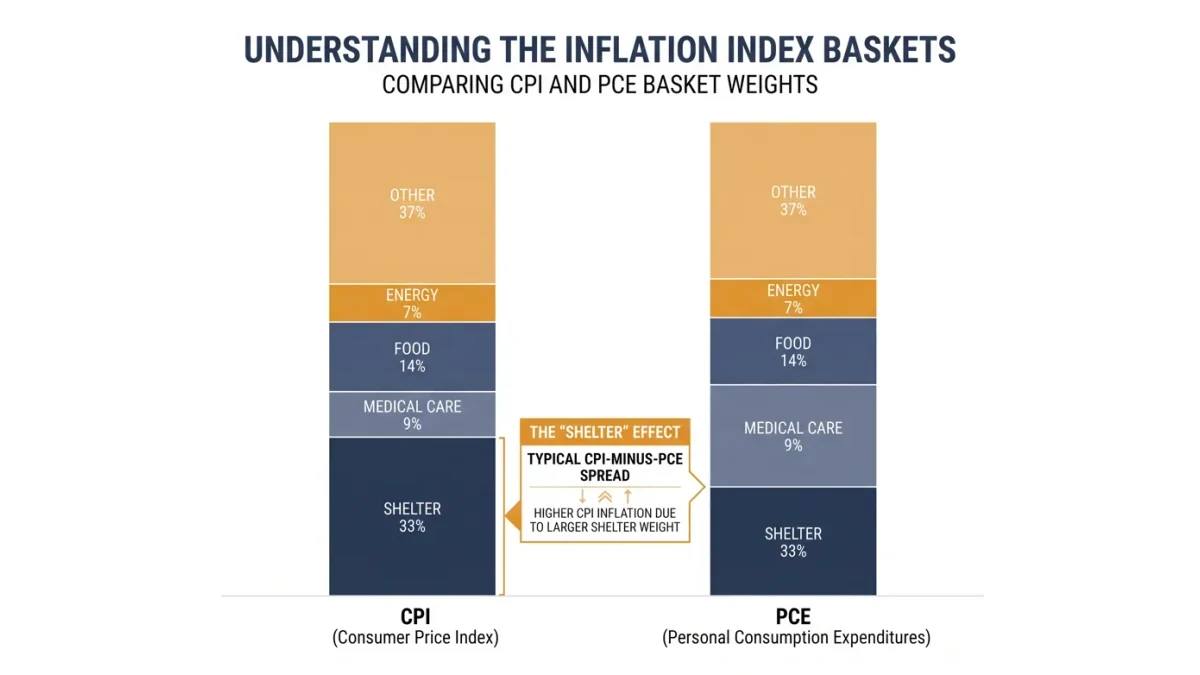
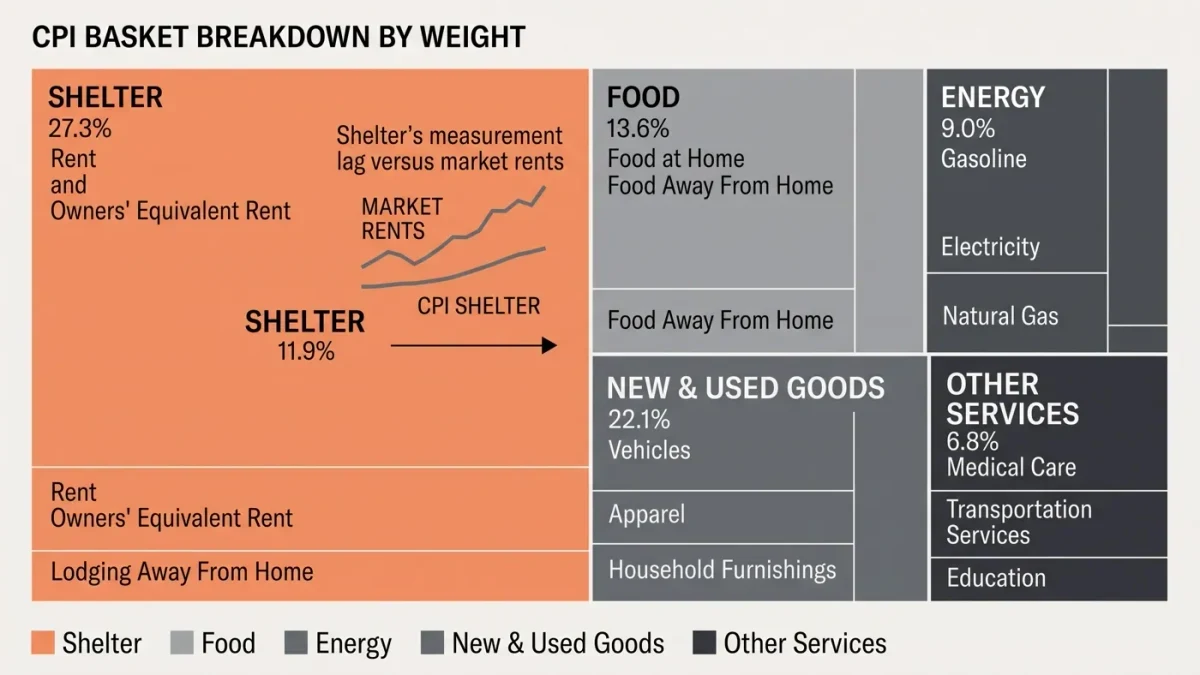
Shelter is the largest component — roughly a third of the index — and it moves slowly by construction. The CPI's shelter measure relies on rent surveys that refresh over months, so it lags market rents by a year or more. That lag cut both ways in this cycle: as new-lease rents cooled in 2023-2024, CPI shelter kept the measured inflation rate elevated; eventually the catch-up arrives. When you see a CPI print driven by shelter, you are seeing arithmetic from a year ago, not news from this month. The market-rent trackers move first; CPI shelter confirms last.
How do tariffs show up in CPI?
In goods categories, with a lag, partially, and unevenly. Pass-through research from the 2018-2019 episodes found the cost mostly stayed in the US; for consumers, tariffed goods' prices rose while the timing depended on inventories and contracts. In the 2025-2026 cycle the same pattern returned: goods categories with tariff exposure — appliances, electronics, tools — carried visible price increases that arrived over months rather than in a single print, per BLS data as analyzed in economic commentary. Two cautions follow. First, a level shift is not inflation: a tariff that raises a price once raises the 12-month rate while it passes through, then drops out of the arithmetic. Second, substitution blunts measurement — buyers switch to unraised alternatives, so the measured effect understates the full pass-through cost to living standards.
What is the reading routine?
Four checks, in order. Headline versus core: if they diverge, ask which component — energy swings move headline; core moves matter more for trend. Shelter contribution: strip it mentally and ask what the rest of the index did — the ex-shelter core is the cleanest cyclical signal. Goods versus services: durable-goods deflation has been the long-term trend; a sustained goods-inflation turn is a tariff-era marker. Distribution, not just the mean: the share of categories rising faster than 5% tells you whether broad pressure is building or a few volatile items are misbehaving. Then compare against the same month's year-ago reading, because base effects — last year's odd month — can manufacture or mask a trend.
What does CPI not tell you?
Producers' costs — that is the PPI. Trade volumes, wages, or the GDP deflator, which covers a different universe. And it does not tell you what the Fed will do: the committee weighs labor-market data alongside inflation, as the December 2025 meeting's 9-3 vote demonstrated. CPI is the best-measured price of the household's month. It deserves precisely the respect of a well-built statistic — quoted with vintage, component, and context — and not the ritual of a number that either soothes or panics.