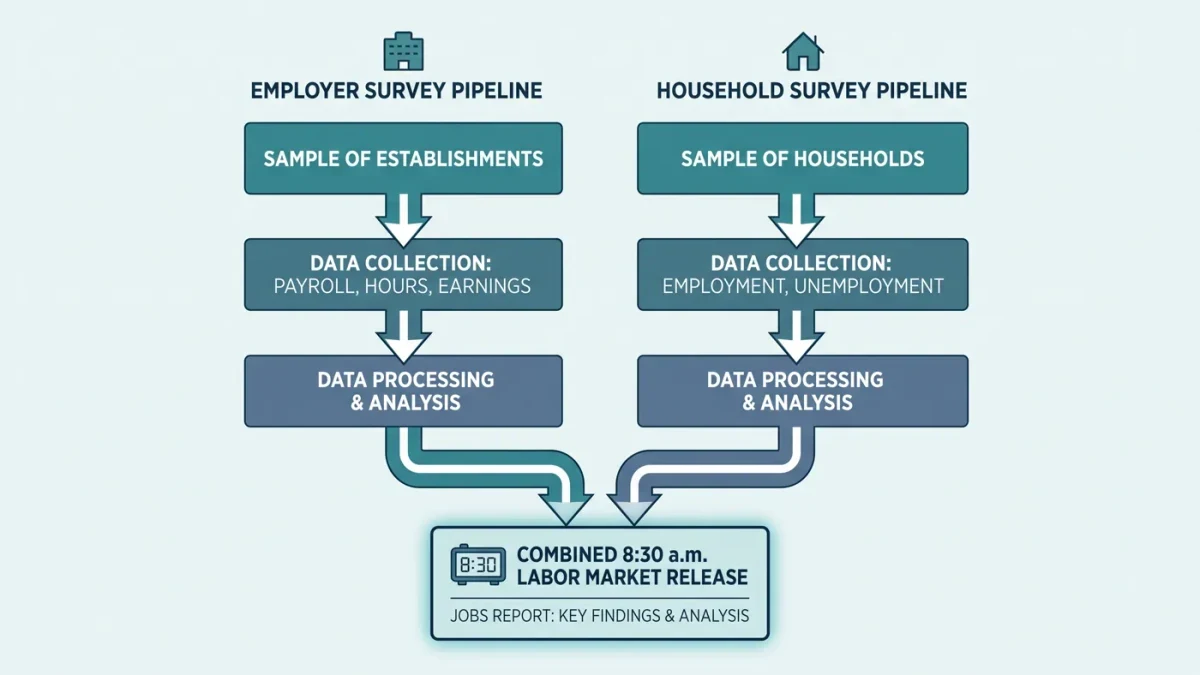
Jobs day is the economy's monthly sprint: one release, 8:30 a.m., and every market and headline written from it within minutes. The release is dense — payroll growth, the unemployment rate, revisions, hours, wages, and a dozen industry cuts — and most of the immediate commentary quotes the two loudest numbers. The readers who do better treat the document as two surveys answering different questions, with known failure modes in each.
Two surveys, two truths
The establishment survey asks employers about jobs, hours, and pay — it produces payroll growth, the workweek, and hourly earnings. The household survey asks people whether they worked or looked for work — it produces the unemployment rate and the labor-force participation rate. The two can move in opposite directions in the same month without either being wrong: they measure different universes with different methods, and the payroll count excludes agriculture and the self-employed while the household survey includes them. When you see the unemployment rate fall because participation fell — people exiting rather than people hired — you are watching the household survey's most misread move.
What are the known distortions?
Sampling noise first: the monthly payroll change carries a standard error around 60,000 or more, per BLS technical notes, so small moves are statistically indistinguishable from zero. Revisions second: each month's print is preliminary, revised twice, and re-benchmarked annually against unemployment-insurance records. Strikes move payroll counts mechanically — a large work stoppage removes workers and returns them. Weather and disasters distort both surveys' collection weeks. And the birth-death model — the statistical adjustment for new firms opening and old ones closing — adds or subtracts jobs that no one counted, which is why late-cycle turns are often visible in revisions before they are visible in prints.
Which lines carry the signal?
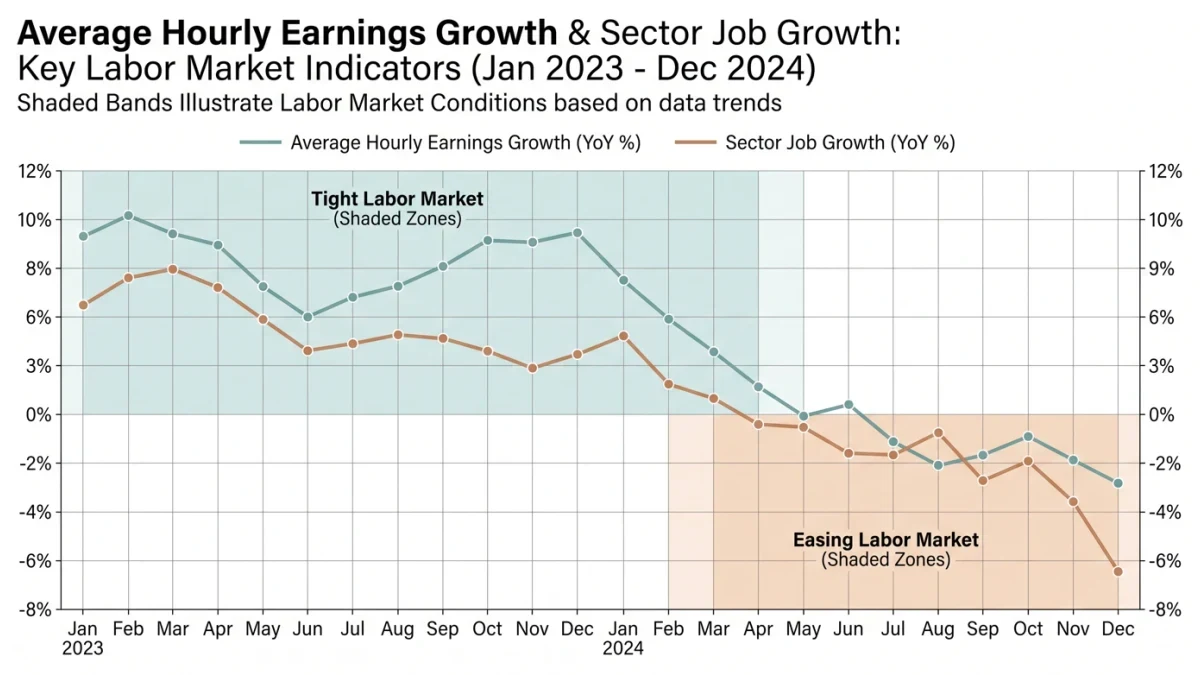
The workweek and overtime, because employers cut hours before heads. Average hourly earnings, read against productivity rather than in isolation — wage growth near productivity growth is sustainable; the spread between them is the inflation-relevant measure. The participation rate, which decides whether unemployment is falling for good reasons. The diffusion index — the share of industries adding jobs — which turns ahead of the payroll level at cycle ends. Underemployment measures for the slack the headline rate hides. For manufacturing readers specifically: the factory split, durable versus nondurable, plus the factory workweek, leads the industrial cycle by months.
How does policy-era noise show up?
Tariff cycles add composition churn: protected industries add while downstream users cut, leaving the net ambiguous. Government employment swings with federal policy — hiring surges, shutdown furloughs — that say more about appropriations than the economy. Immigration enforcement changes labor supply in construction, agriculture, and hospitality, moving participation and wage data simultaneously. None of these are distortions to be stripped out; they are the economy being restructured, and the industry detail is where the restructuring is legible.
The routine
Read the revisions before the print. Check the household-establishment divergence. Look at hours, wages, participation, and diffusion before forming a view from payroll growth alone. Note any strike, weather, or collection-issue footnote. Then write your conclusion in pencil — next month's revisions are the eraser. Jobs day is not a verdict on the economy; it is the best monthly measurement we have, arriving early, revised late, and rewarding exactly the readers who respect both facts.